Panelbear is now Cronitor RUM
-
 Traffic, performance and errors in a single tool
-
Cookie-free and designed for privacy
-
Powerful monitoring and alerting, built-in
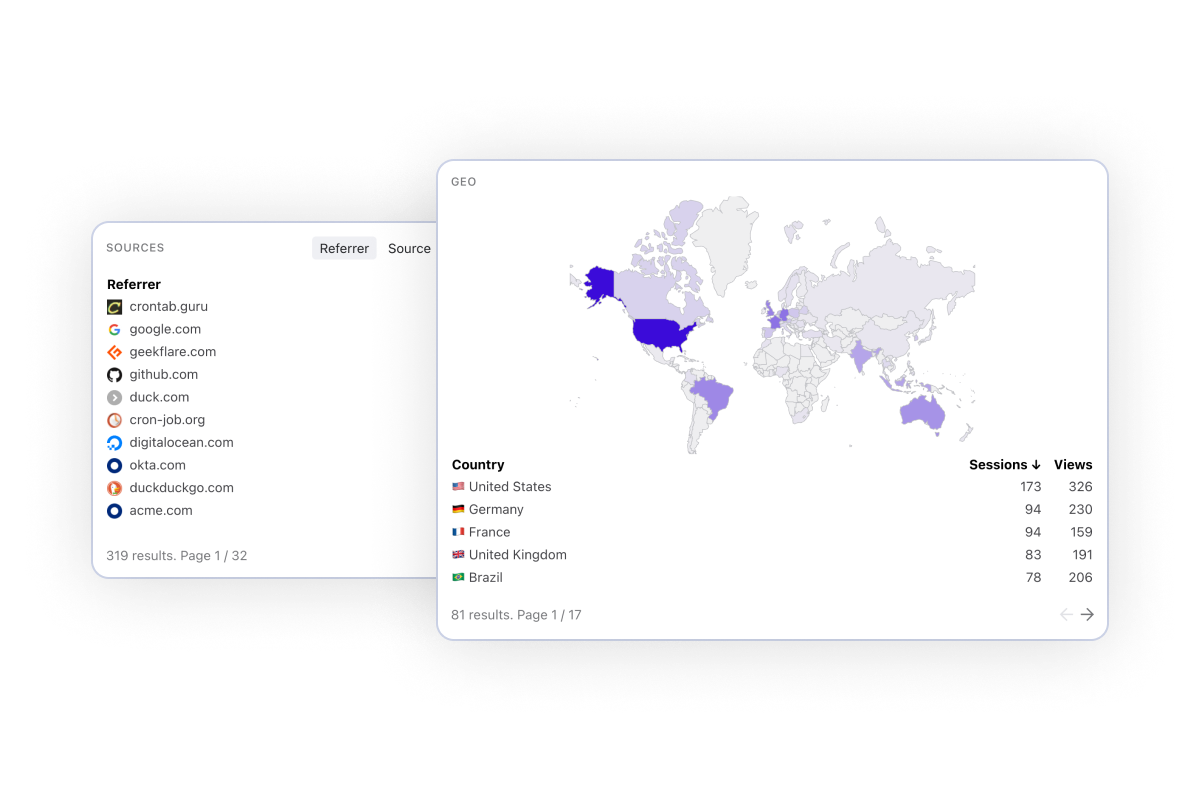
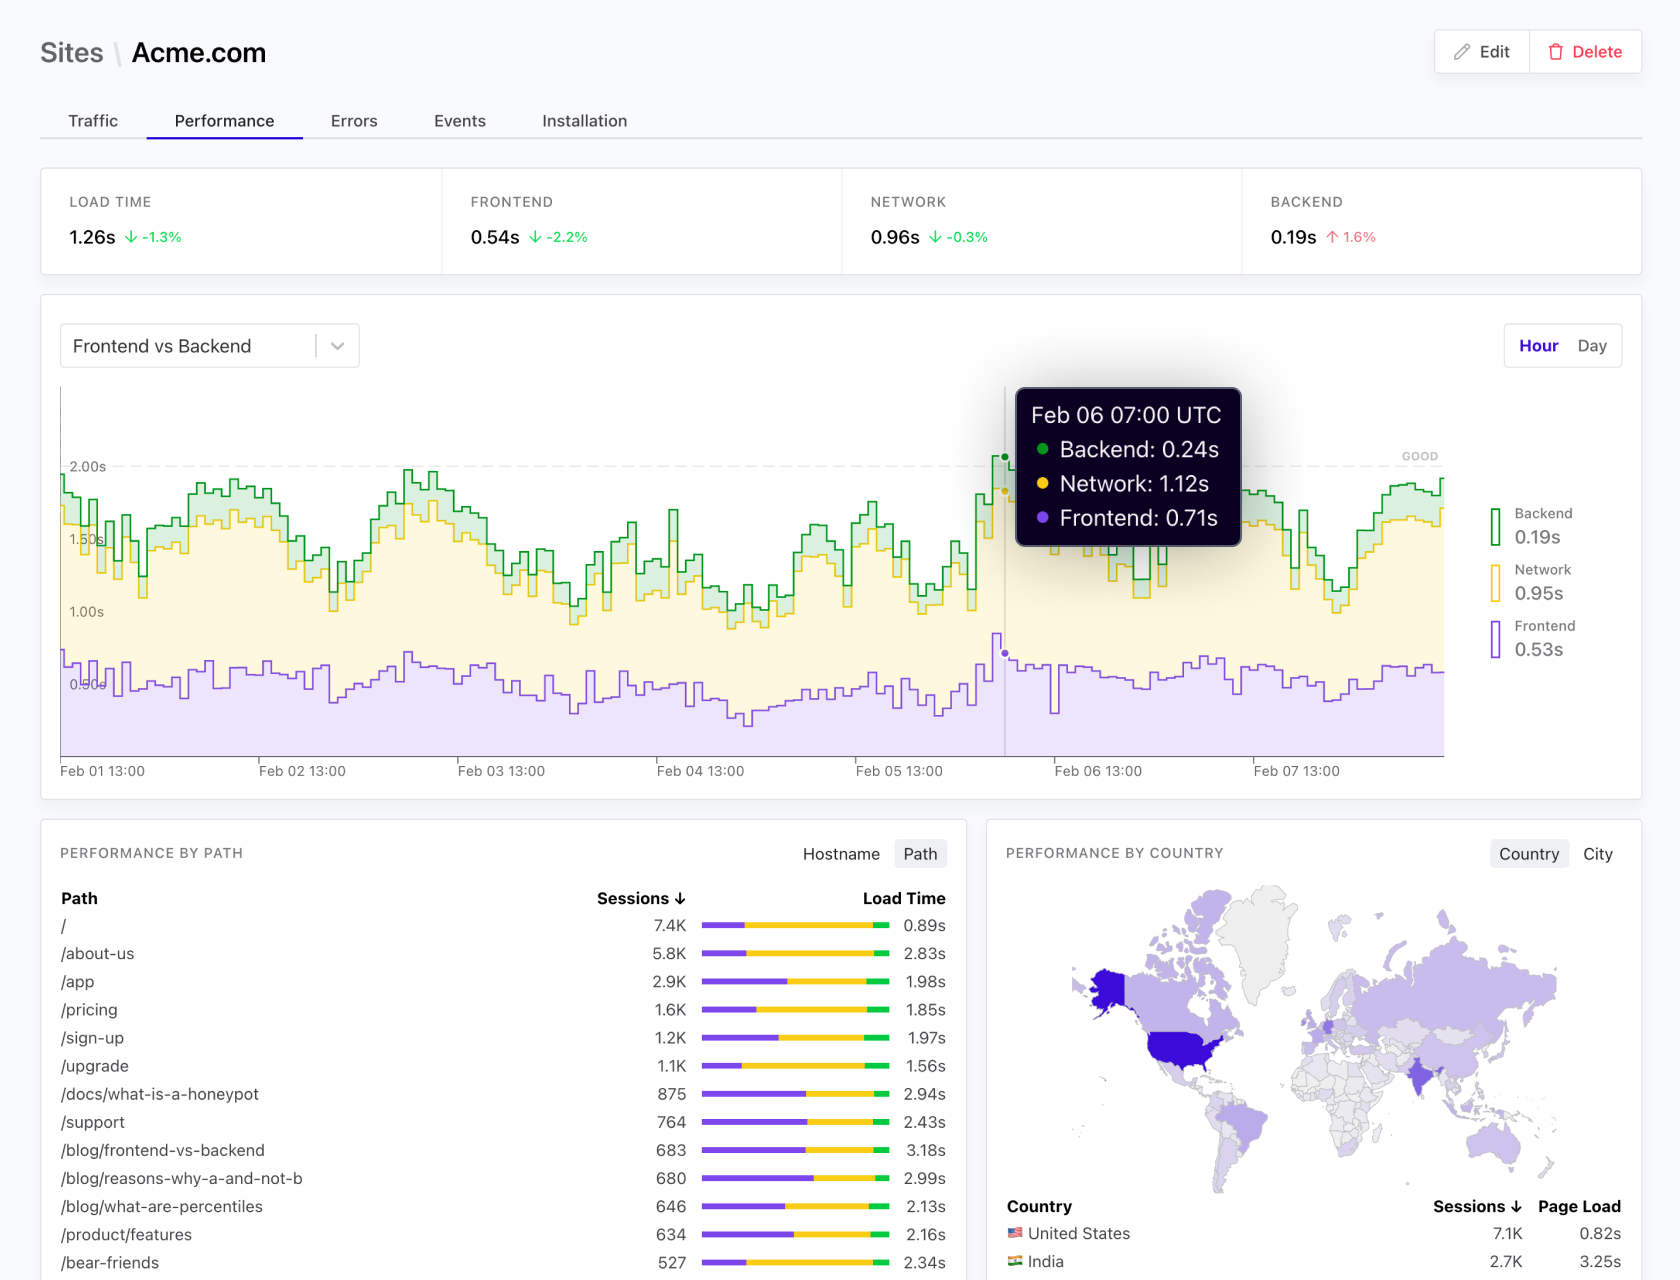
Monitor what's happening on your website in real-time. Measure and compare visit by country, browser and referrer to better understand your traffic.
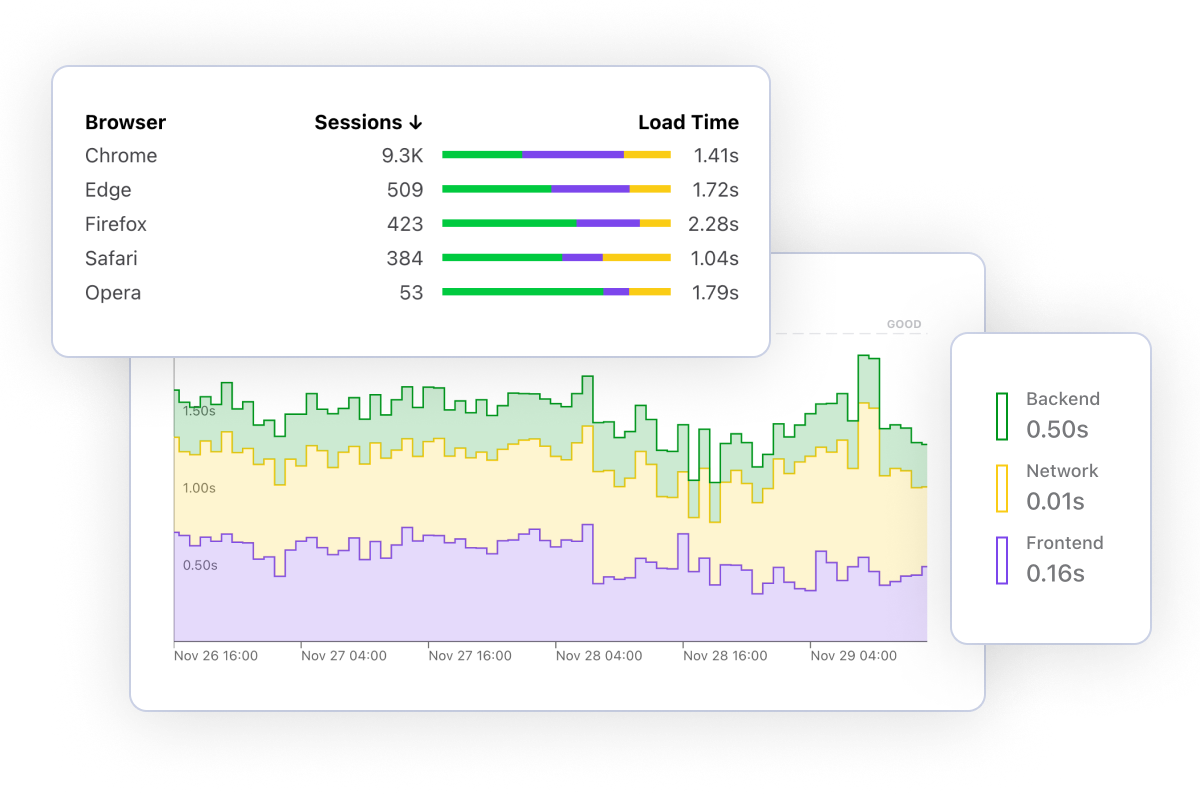
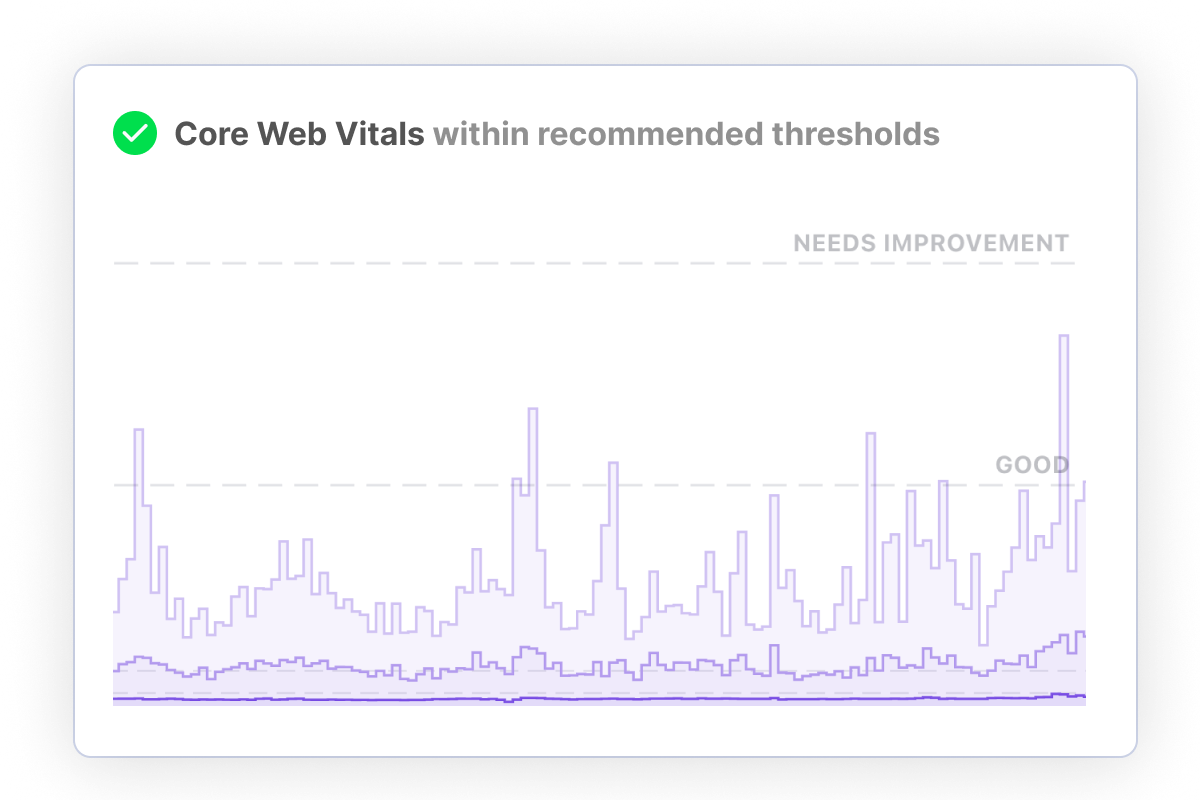
Frustrated visitors are more likely to abandon your site. Measure key performance metrics such as Page Load Time and Core Web Vitals. Breakdown by time spent on DNS, SSL, Network, Rendering and more.
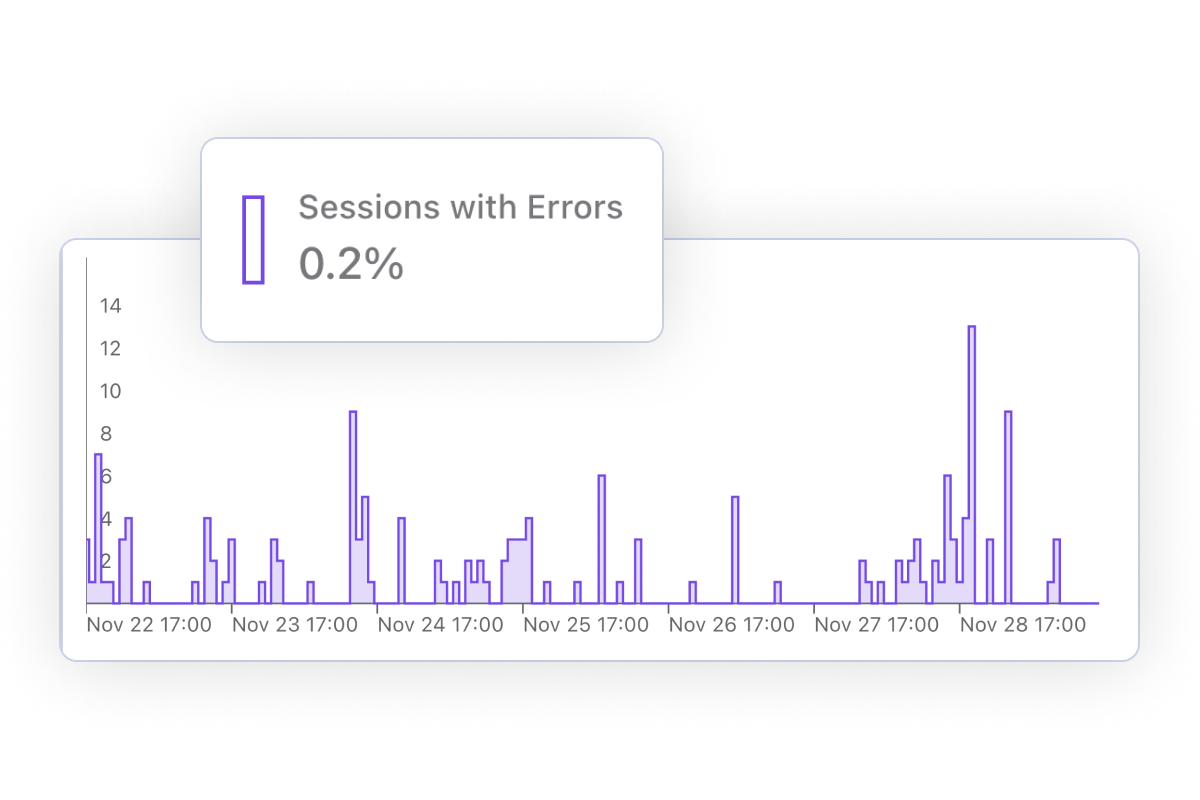
Correlate errors and performance issues with impacted conversion rates. Segment your traffic to understand which countries or browsers are most affected.
Configure alerts for traffic spikes, performance regressions and more. Identify and troubleshoot issues before they impact your business.

We automatically de-personalize visitor data, and don't use tracking cookies. Our analytics script is fully open source, and you can process personal data on a server you control. Read more on how we handle personal data.
Cronitor gives you instant visibility into the health of your software. From frontend to backend - we've got you covered.
Monitor your websites and APIs from 12+ locations worldwide
Monitor your cron jobs and background tasks
Monitor anything by sending a simple event
Measure your website's most important metrics, in real time
Communicate service reliability and downtime
Join 60,000+ developers, and thousands of customers all around the globe.
Access dozens of website metrics in real time. From conversion rate to page load time by country to top referrers - we've got you covered.
Frustrated visitors are more likely to leave your site. Troubleshoot issues and improve the performance of your most important pages.
Drill down by country, page, referrer or any other dimension. Compare metrics to surface gaps and opportunities for performance improvements.
Understand which browsers, devices and operating systems is your website most popular in so you can prioritize your efforts.
Track which website errors are impacting your business. Breakdown by country or browser to troubleshoot issues faster.
Measure and improve how relevant is your content to your visitors. Reduce friction and deliver a better experience on your website.
Our SDK is super lightweight and does not slow down your website. User data is automatically de-personalized so it can't be traced back to a person.
Receive notifications whenever something's up. Next time your site is trending on social media you'll be the first to know.
Get daily, weekly or monthly traffic reports delivered straight to your inbox. Stay up-to-date with your website's most important metrics.
Uptime last 12 months
Events received per day
Website & API checks per day
Jobs monitored per day
Alerts sent per day
Founded in California

"Cronitor has increased our Operations staff's efficiency and responsiveness immensely. Their spin on micro-monitoring represents a best-in-class solution to the age old problem of visibility."
Ethan Erchinger Director of Operations

"I was finding too many cases where our cron jobs would silently fail - we sometimes would not find out for days that a job was broken. Cronitor gives our team the confidence and peace of mind that if a job is not running, we'll know fast."
Gary Malouf VP of Technology

"Before we used Cronitor, we had an important data backup job fail silently for over a month. We use Cronitor so that will never happen again!"
Natalie Gordon CEO