Google Analytics: Users vs Sessions vs Pageviews

December 9, 2021·9 min read

To beginner (and even intermediate) product managers, marketers and data scientists the huge variety of website metrics out there to track can be overwhelming. In this article, we'll be taking a deep dive into three of the most popular metrics around: sessions, pageviews, and users.

We'll be covering what they are, why they're important, and most importantly, how to track them using Google Analytics (along with a GA alternative - more on that later). By the end, you'll have all the tools you need to get the most out of your traffic analysis.

Table of Contents

What are sessions?

In Google Analytics, a session is a period of user activity on your website. It begins when a user first loads a page and ends when: a) they exit the page or b) they're inactive for more than 30 minutes.

During a session, a user can rack up an infinite number of pageviews, transactions, and interactions. As long as they aren't inactive for more than 30 minutes, all of these events will be counted within a single session.

The 30 minute rule is important because it helps Google Analytics weed out inaccurate session data. We all have tabs that we leave open for weeks at a time. If that data was counted it would be incredibly difficult to gain any valuable information from metrics like session duration or session interval.

How does Google Analytics track sessions?

Google Analytics uses cookies to track user activity while on-site and reports this as session data. The cookies used are smart enough to recognize when a user reopens your website in a new tab meaning that opening internal links won't end a session.

Why are sessions important?

Sessions are a foundational traffic metric that can contain a wealth of additional information inside of them. For starters, a session will contain all pageviews, hits, and transactions a user engaged in during their visit. This is invaluable information for marketers as it offers an incredibly clear picture of the user's journey on a website. In addition, the duration of a session and the interval between a user's sessions can all be interpreted to great effect.

Example: If the same users are incredibly engaged with the website's content (long average session duration and low session interval) but aren't converting at a good rate, it's likely that the website's content isn't working as a presentation of the business's value (even if users enjoy it). Make sure that there are hooks within your content to convert them into email subscribers or paying customers.

Example: If users spend a long time on-site (long session duration), rarely return (high session interval), and their session data reveals an odd sequence of pageviews and hits, it's likely that they're struggling to get through your sales funnel. A solution to this is to, well, understand which flows convert the best and optimize your content and website to usher your users towards embarking on that particular journey.

How to track sessions in Google Analytics

Google Analytics automatically tracks sessions. The process for accessing this basic data is incredibly simple:

  1. On the left-most panel of the GA UI, click on the Audience tab.

  2. Select Overview from the dropdown menu.

  3. A raw Sessions count will appear along with some related metrics.

Track sessions in Google Analytics

However, many will want to take a deeper dive into the data. To access acquisition session data, follow these steps:

  1. On the left-most panel of the GA UI, click on the Acquisition tab.

  2. This time, skip the Overview tab. Click on All Traffic and Source/Medium instead.

  3. See a list of traffic sources sorted by the number of sessions they produced.

Track acquisition session count in Google Analytics

This tab is great for assessing the value of different referring domains that link back to your site. Keeping tabs on the channels that funnel traffic back to your site is crucial for developing effective engagement strategies and tracking session referrals is one way to do this.

What are pageviews?

A pageview is a request for a page, image, or file. Viewing a single page can sometimes require more than one pageview if there are multiple code snippets required to render the pages's content.

For example, it's not uncommon to use two separate snippets on a homepage (e.g., jQuery and CSS) in order to render all of the elements on your site and make them interactive. This will result in two pageviews by default.

In addition, multiple pageviews will also be recorded if a user clicks away from a page and reloads it. Theoretically, a user could reload a page an infinite number of times during an observation period and seriously skew a website's pageview metric… but the odds of that are slim.

Pageviews vs unique pageviews

Unique pageviews is a metric that solves a few of the fairly obvious problems with pageviews (namely, that duplicates and accidental pageviews are common). Essentially, unique pageviews count all pageviews (within a single session) as a single unique page view. Don't worry if that was confusing, I'll give you a quick example:

  • If you click a link that brings you to this article, our system logs one pageview and one unique pageview.
  • If you immediately reload this page our system will log two pageviews and one unique pageview.
  • If you come back in a week our system will log three pageviews and two unique pageviews.

Why are pageviews important?

When it comes down to it, pageviews aren't the most important metric in your arsenal. It's just too hard to interpret the results in any meaningful way without the help of other metrics for contextualization.

Example: Your website is logging a ton of pageviews per visit. Does that mean users are binging your content? Or, does it mean that users can't find what they're looking for?

With that being said, pageviews can (tentatively) be used as a basic metric of engagement. It's rare that users reload pages enough times to seriously impact the results.

How to track pageviews in Google Analytics

Google Analytics tracks pageviews by default, so you don't need to do anything special to start tracking them. Once again, accessing this basic data is easy:

  1. On the left-most panel of the GA UI, click on the Audience tab.

  2. Select Overview from the dropdown menu.

  3. A raw Pageviews count will appear along with some related metrics.

  4. Go to Behavior' → site content → All Pages to get a rundown of your pageviews and unique pageviews for each page.

Track pageviews in Google Analytics

What are users?

A user is a person (well, a device or browser) who has been recorded as having accessed your website over a certain period of measurement. A single user cannot have multiple sessions in a given period measurement, though they can be responsible for multiple pageviews.

In other words, a single user may have had more than one page view or session with your site, but they will only be counted once within the specific time frame you are analyzing (e.g., day, month).

If a user returns again during a different analysis period they may be counted again, but this will depend on how you configure the tracking software.

Why are users important?

The number of users is an important metric because it's an indicator of website reach and engagement. The higher the number of users, the more people you've been able to reach with your content.

Additionally, the longer users stay on your site, the more likely they are to convert (by signing up for a mailing list, buying a product, etc.) and the more traffic you can expect to see from search engines.

How to view users in Google Analytics

You can learn how many users visited your site during a given time period by using the “Users” report under the “Content” section. To access this report:

  1. On the left-most panel of the GA UI, click on the Audience tab.

  2. Select Overview from the dropdown menu.

  3. A raw Users count will appear along with some related metrics.

Track users in Google Analytics

  1. On the left-most panel of the GA UI, click on the Acquisition tab.

  2. Once again, skip the Overview tab. Click on All TrafficSource/Medium.

  3. See a list of traffic sources sorted by the number of users they produced.

Track acquisition users in Google Analytics

Once again, this data is invaluable as a tool for fine-tuning your business's engagement strategy. It can also be used to measure the direct impact of engagement campaigns. User statistics from before a campaign is launched can be compared to user statistics after the campaign has been received. In tandem with the referral data, this can help marketers assess the effectiveness of individual campaigns.

Sessions vs pageviews vs users: Which is best to track?

Overall, according to Databox, sessions are favored by a slight majority of marketers.

Databox infographic: sessions vs pageviews Source: Databox

With that being said, which metrics you should devote your attention to depends on your goals. In many cases your goals will require an approach that tracks and correlates some combination of metrics:

  • Do you want to get a sense of how engaging your website is to users? Pages per session and session durations might be metrics to look into.
  • Do you want to understand your audience's demographic better? Sorting users by country, age, or device used is a great way to go about it.
  • Do you want a glimpse into an average customer journey? Time on page will allow you to see how long people are spending on each page of your website.
  • Do you want to assess the effectiveness of different traffic channels? Session referring domain is the way to go.

In the end, it's up to you to decide which metric provides the most value for your business. As always, be sure to test different metrics and see which ones produce the best results.

Is Google Analytics the best tool for the job?

Not necessarily. While GA is an undeniably great tool for marketers, it isn't perfect. The software has a number of flaws that may push both beginner and expert traffic analysts alike towards alternatives. Let's take a closer look at some of the biggest ones:

Overcomplicated

Google Analytics can be over complicated – especially for people who don't have a ton of experience with traffic analysis. In total, the service collects over 200 data points. How many of those are useful to the average user? A very small percentage.

On the other hand, alternatives like Panelbear simplify reporting to metrics that marketers and webmasters actually need, including the ones you just saw.

Google Analytics alternative Panelbear is a simpler alternative to Google Analytics.

From the top of the home screen you can access sessions, pageviews, session duration, and six other vital website metrics that will be useful to every website owner, not just a select few.

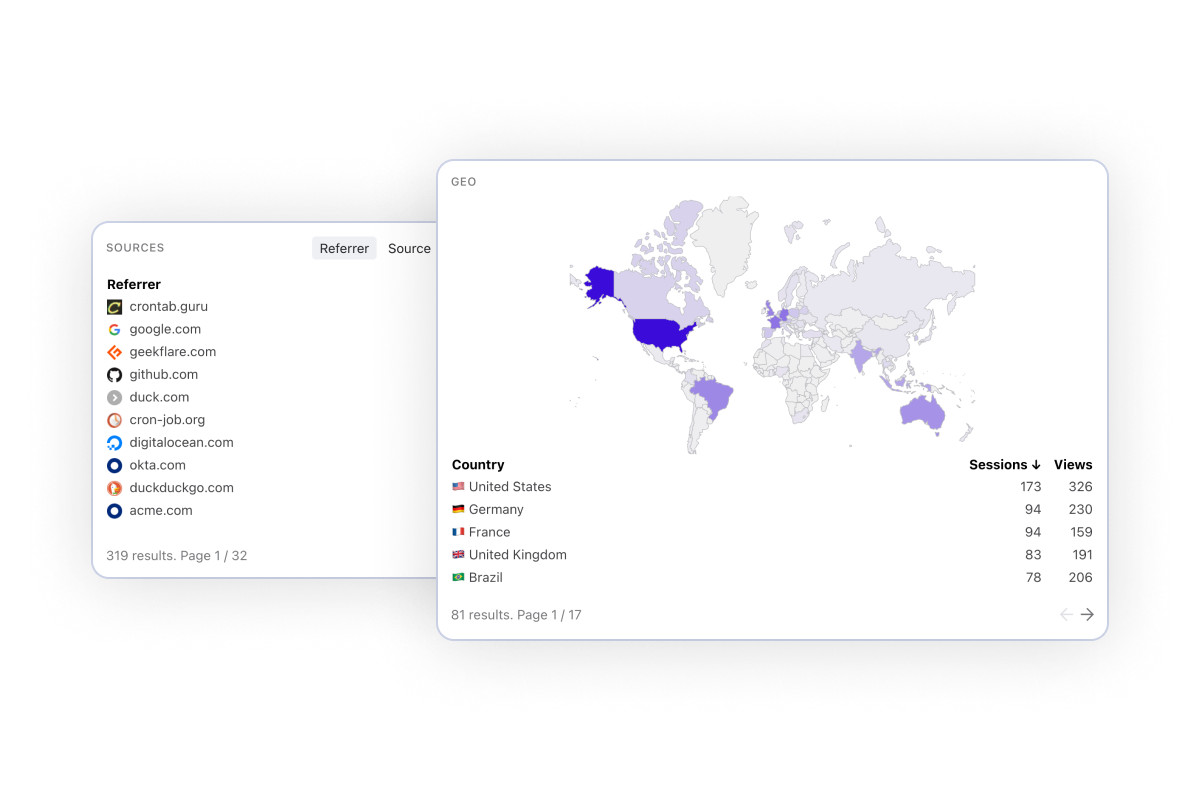
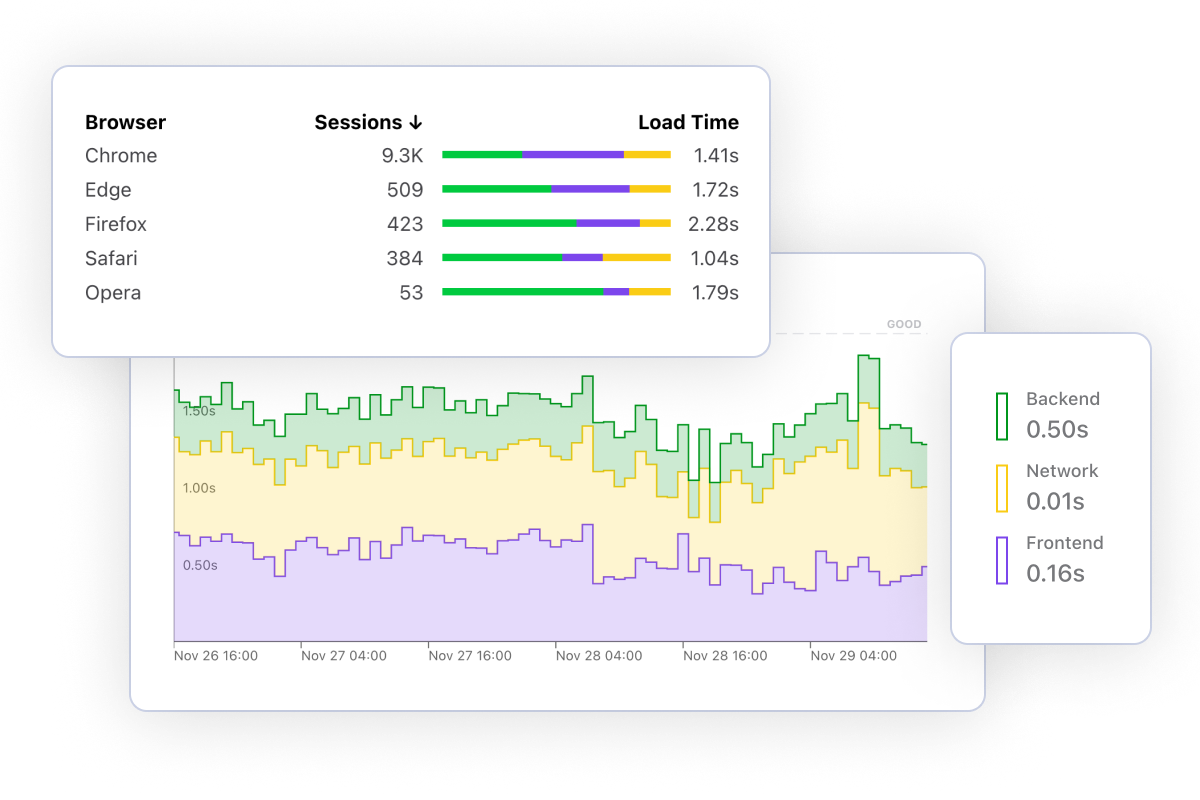
Further down the page you'll find device data, traffic source data, and even geographical data. There's no need to search through different tabs and reports to find the metric you're looking for - everything's right in front of you!

Privacy concerns

Google Analytics tracks user behavior on your website using cookies, and Google may use this data for their own purposes. Many people see this practice as invasive, and it raises privacy concerns for website owners and their visitors.

In contrast, Panelbear is privacy friendly out of the box. Our service stores its data in the EU, doesn't track IP addresses, doesn't use tracking cookies, and we never sell data to third parties.

Performance monitoring

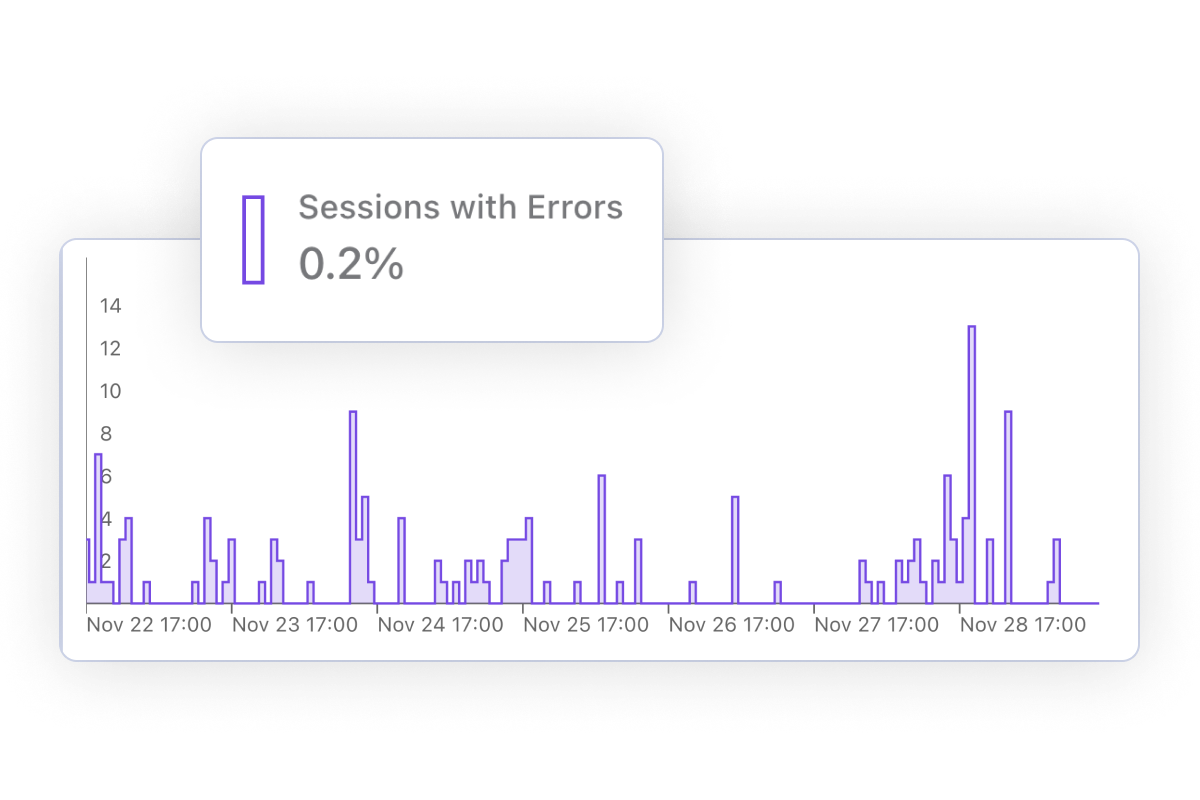
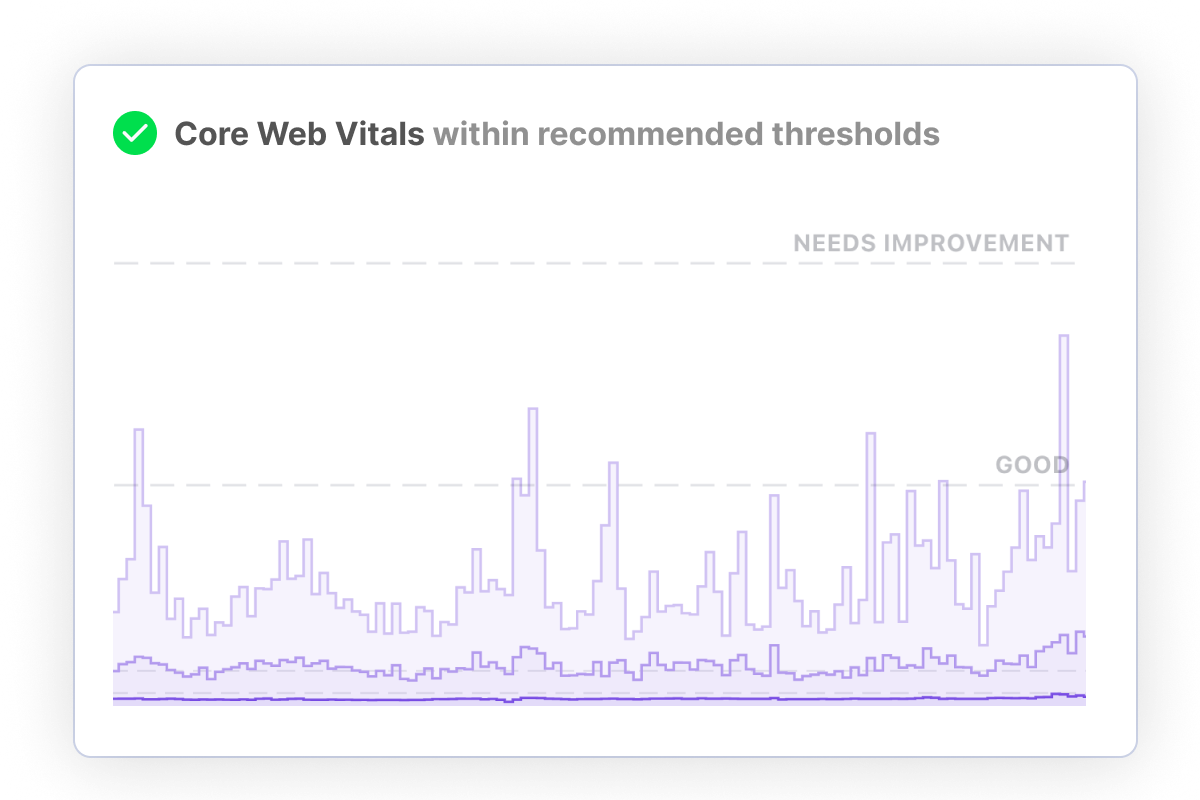
While Google Analytics is incredibly comprehensive when it comes to traffic metrics, it lacks real performance tracking capabilities. Panelbear offers real-time performance monitoring and alerts that keep business owners in the loop as problems arise.

In conclusion

To conclude, there isn't really a right answer when it comes to choosing a metric to measure.

Each has its strengths and weaknesses and each provides insights into different areas of website performance. Rather than focusing on one at the expense of another, try to consolidate all three into a holistic understanding of your website's traffic.

Panelbear makes it easy to do just that with a clean dashboard that summarizes your websites most important metrics. That way you can focus on key insights and make the most of your time and data.


Share article

Website traffic and performance insights.

Free plan available · No credit card required

Start for free
Panelbear dashboard